Sunday, December 20, 2015

What did 2015 mean to Operational System?

As we enter the final weeks of 2015, did it live up to what we expected, what trends did it star to cement into Operational System design.

These are just some of observations I have seen:

1/ Shift to significant operational transformation programs, vs just projects, as accelerated in the second half of 2015. Certainly we have seen a lot of projects initially started or investigated as projects in 2014, in 2015 reemerge as multi-site, multiyear transformation programs. With the understanding that these programs are on journey both in technology, but also operational goals/ outcomes, and culture.
Certainly a couple of us have seen a significant amount of time allocated to evolving these opportunities working with the customer to help define their outcomes, the approaches, this has been and is still continuing as educational process for all involved. This is fundamentally changing the engagement models between end user vendors and engineering houses as a partnership, requiring changes on both sides.

2/ Cyber Security/ Application Security: This continues to grow as a huge area of interest, but this year it shifted not only how to secure, but how to maintain successfully, evolve their business and agile operations in a tighter security model. Realization that cost is not just in setting up a secure operational environment, but the cost of evolving and sustaining it while maintaining an agile business requires a strategy on it’s own.

3/ Operational Awareness/ Effectiveness: Understanding, not the “aging workforce” but the transformation in both “workforce culture/ approach” and transformation in “Workspace”  are real. That today's and last ten years of operational systems will not satisfy the agile decisions that required, but also the changing workspace culture and methods. The amount of workshops and strategies sessions I have asked to be involved in 2015 was three times that of 2014, and they were clear strategic discussions around people and how people will operate in the future.

4/ Understanding and reality of Internet of Things: The hype has been here and continues around IOT. But there has been some real sole searching in many industrial companies to understanding what it means to them. Many it dawned as the operational alignment end efficiencies they have in the “walls of the plant” now can extend to the “mobile plant”. In Oil and Gas, and Mining moving to include “extraction” wells, equipment in the operational process in real-time. In many other industries, it moved the mobile receivables plants, distribution trucks and then the distribution centers, etc. to be included in the “end to end” operational control.

5/ Realization that the Operational architecture of the future near and long term will have Internet and “cloud” as a natural part of it, and we must design the security, and systems assuming on premise and off premise architecture.

All of the above does surprise us, based on the trends, but it is good to see the shift from talk to reality. I would expect that 2016 this strategic journey programs to increase. Certainly the scope of operational responsibility is changing include a end to end supply chain, that means move outside the plant walls with the traditional systems, and we will see the alignment of Process operations and utility operations (power) into one operational strategy and control.   


Have a very happy holiday season and may 2016 continue the momentum to deliver operational solutions that will handle the "operational transformation" happening around us.

Sunday, December 6, 2015

Accelerated Training is the only way to Deal with Dynamic Workforce Paradigm

As time period workers are in a role and especially a site, the systems and culture of learning, interacting and gaining knowledge must change. This happens with the knowledge and learning coming from this system as the worker requires and prepares for executing a task, vs tradition class / face to face sessions.

Operations teams in a broad range of manufacturing have discovered that the workforce, especially operators, are changing jobs more frequently.  This challenge has become more important than the “aging workforce”, although this also contributes to the acceleration of turnover.  There must be a strategy which effectively trains operators faster than their turnover.

One part of training best practices is to continue the training throughout the operators’ work term, such as summarized in the following diagrams:


The right-hand diagram summarizes some amount of acceleration in benefits, where OTJ is on-the-job training.  While this acceleration appears to be attractive, this acceleration isn’t enough – the time to profitability is still several years.  So an additional strategy is necessary, as shown in the following diagram:


The above diagram describes a strategy of acceleration: instead of focusing on the basics, the training focuses on the dynamic aspects.  This means that the operators are trained as early as possible on “advanced” topics.
The power generation industry has developed a measure of operator excellence called “error free”.  It is a measure where loss of production or damage to equipment was identified with operator errors.  During the last 7 years, power generation companies have demonstrated up to 6:1 acceleration in achieving “error free” status.
The technical change in the training simulators is focused on simulating the dynamic aspects such as weather, supply chain demand and changes in raw materials.

Sunday, November 29, 2015

Forecasting and Predicting, Must be a Cornerstone of the Modern Operational System

For the last couple of weeks Stan and I have been working with a number of leading companies in Oil and Gas, Mining, and F & B around their Operational Landscape or experience of the future.
Too often the conversations start off from a technology point, and we spend the initial couple of days trying to swing the conversation to the way in which they need to operate in the future and what their plans are around operations.

It becomes clear very quickly that there is allot of good intent, but real thought into how they need to operate in order to meet production expectations both in products and margin has not been worked through.

Over and over again we see the need for faster decisions, in a changing agile world, and this requires an "understanding of the future" this maybe only 1/2 hour. The time span of future required for decisions depends on role, (same as history) but it is clear that modeling of future is not just something for the planner, it is will become a native part of all operational systems.

This blog from Stan captures some of the necessary concepts.
  
Operations management systems must deliver better orientation than traditional reporting or decision support systems.  One important aspect of operations is the dynamic nature – there will be a journey of changing schedules, changing raw material capabilities, changing product requirements and changing equipment or process capabilities.


It might be helpful to consider desired and undesired conditions, using the analogy of driving a car on a long trip.  The planned route has turns, and it may involve traffic jams, detours, poor visibility due to heavy rain or fog; the driver and the car must stop periodically; and the driver may receive a telephone call to modify the route.  The following diagram is a sketch which displays how an integrated view might appear:

In the above example, the actual performance is at the upper limit for the target, and the scheduled target and constraints will shift upward in the near future.  The constraint is currently much higher than the scheduled target limits, but it is forecast-ed to change so that in some conditions in the future, the constraint will not allow some ranges of targets and limits.  This simple view shows a single operations measure with its associated constraints and target.
  • At this stage, we propose a definition of “forecasting”: a future trend which is a series of pairs of information, where the pairs include a value and a time.  The accuracy of the values will be poorer as the time increases, but the direction of the trend (trending down or up, or cycling) and the values in the near future are sufficiently useful.
  • In contrast, “predicting” is an estimate that a recognized event will likely happen in the future, but the timing is uncertain.  This is useful for understanding “imminent” failures.

The following diagram shows an example of estimating the probabilities of 5 failure categories, where the first (rotor thermal expansion) is the most likely.


Given these two definitions, it is helpful to consider industrial equipment behaviors.
  • Several types of equipment, especially fixed equipment such as heat exchangers, chillers, fired heaters etc. exhibit a gradual reduction in efficiency or capacity, or exhibit varying capability depending upon ambient temperature and the temperature of the heat transfer fluid (e.g. steam, hot oil, chilled water).  While the performance is changing, the equipment hasn’t failed, although its performance might reach a level which justifies an overhaul.  In extreme cases, sudden failures can occur, such as tube rupture or complete blockage.  These benefit from “forecasting”.
  • Other types of equipment, such as agitators, pumps, turbines, compressors etc. exhibit sudden failures.  These benefit from “predicting”.

One analogy of incorporating both “forecasting” and “predicting” is that it is like driving a car without looking forward through the windshield/windscreen, such as shown in the following sketch:


In the above sketch, the road behind the car is clear, but ahead, a potential collision will occur.  High-performance operations requires that teams prevent unplanned shutdowns or other events.

Saturday, November 21, 2015

The Benefits if Using TOGAF with ISA-95

Blog by Stan Devries:

ISA-95 is the strongest standard for operations management interoperability, and its focus is on data and its metadata.  ISA-95 continues to evolve, and recent enhancements address the needs of interoperability among many applications, especially at Level 3 (between process control and enterprise software systems).  One way to summarize ISA-95’s focus is on business and information architectures.

TOGAF is the strongest standard for enterprise architecture.  One way to summarize TOGAF’s focus is on business architecture, information architecture, systems/application architecture and technology architectures.  When considered with this perspective, ISA-95 becomes the best expression of the data architecture within TOGAF, and ISA-95 becomes the best expression of portions of the business architecture.  Central to the TOGAF standard is an architecture development method (ADM), which encourages stakeholders and architects to consider the users and their interactions with the architecture before considering the required data.  The key diagram which summarizes this method is the following:
The circular representation and its arrows summarize the governance features.  One example is the architecture vision (module A in the above diagram).  This vision could include the following principles as examples:
  •          Mobile will be a “first class citizen”
  •          Interaction with users will be proactive wherever possible
  •          Certain refinery operations must continue to run without core dependencies
  •          Take advantage of Cloud services when possible


This framework provides a better language for each group of stakeholders.  The following table, which is derived from the Zachman framework, maps these stakeholders to a set of simple categories:


The categories of “when” and “motivation” enables the architecture governance to consider transformational requirements, such as prevention of undesired situations and optimization of desired situations.  In this context, ISA-95 adds value in Data (what) and Function (how), for all of the stakeholders, but it doesn’t naturally address where, who, when and why.  Furthermore, ISA-95 doesn’t have a governance framework.  In this context, “where” refers to the architecture’s location, not equipment or material location.
TOGAF lacks the rich modeling for operations management, especially for equipment and material, which is provided by ISA-95.  The combination is powerful and it reduces any tendency to produce passive, geographically restricted architectures.

Friday, November 13, 2015

Information Technology/Operations Technology (IT/OT) for the Oil and Gas Industry

Blog from Stan DeVries

Since 2006, some oil & gas companies have attempted to align what has been called IT and OT with different organization approaches.  It is valuable to consider what these two “worlds” are:
The world of IT is focused on corporate functions, such as ERP, e-mail, office tools etc.  The following key characteristics apply:
  •          The dominant verb is “manage”.
  •          Systems design assumes that humans are the “end points” – information flows begin and end with humans.
  •          The focus is on financial aspects – revenue, margins, earning per share, taxes etc.
  •          The focus is also on cross-functional orchestration of the corporate supply chain
  •          The main technique is reporting – across all sites in the corporation.
  •          One of the methods is to enforce a standard interface between enterprise applications (especially ERP) and the plants/oil fields/refineries/terminals.
  •          Policies for managing information are mostly homogenous, and the primary risk is loss of data.

In contrast, the world of OT is focused on plant operations functions.  The following key characteristics apply:
  •          The dominant verb is “control”.
  •          Systems design assumes that “things” (equipment, materials, product specifications etc.) are the “end points” – information flows can begin and end without humans.
  •          The focus is on operational aspects – quality, throughput, efficiency etc.
  •          The focus is also on providing detailed instructions for operations areas – to equipment and to humans
  •          The main technique is controlling – within a related group of sites or a single site.
  •          One of the methods is to accommodate multiple protocols and equipment interfaces.
  •          Policies are usually diverse and asset-specific; risk includes loss of data, loss of life, loss of environment, loss of product and loss of equipment.


These two worlds must be integrated but their requirements and strategies must be kept separate.  The following diagram suggests a strategy to achieve this:


The above diagram recommends the following methods to bridge these two worlds:
  •          Use a “value generation” metric to justify and harmonize the equal importance of these two worlds.  “Value” can be measured both in terms of financial value (more on this below) and in terms of risk.
  •          Reconcile units of measure using thorough activity-based costing, down to senior operators and the technicians which support them.
  •          Correctly aggregate and disaggregate information at the appropriate frequency.  Operators require hourly information (in some industries, every 15 minutes).
  •          Centralize and distribute information with an approach called “holistic consistency” – allow for the diversity of information structures and names for each area of operation, but enforce consistent structure and naming between sites (or in some cases, between operations areas).
  •          Integrate and interoperate with appropriate methods and standards, which must address visualization, mobility, access and other aspects as well as information.
  •          Apply a consistent cybersecurity approach across multiple areas of the IT/OT system, allowing for information to flow “down” and “across”.  An “air gap” approach has been proven to be unsustainable, but a multi-level approach called “defense in depth” has been proven to be effective and practical.

Oil and gas companies have implemented a variety of organization structures for bridging these two worlds.  Some companies divide IT into two areas, called Infrastructure and Transformation.  New technologies which are strongly linked to new ways of working are first managed by the Transformation section of IT, and then as these mature, they are transferred to Infrastructure.  The main functions of OT are closely linked to Transformation, because operations can continue without OT – OT is almost always a value-add.  We observe the following organizational approaches:
  •         IT reporting to Finance, and OT reporting to Engineering/Technical Services or to Operations
  •         OT reporting to Transformational IT, with an operations-background IT executive

Regardless of the organization approach, the objectives are reliable and business-effective improvement, whether in the office or in the sites.

Saturday, November 7, 2015

Data Diodes for Levels 2-3 and 3-4 Integration

Blog entry by Stan DeVries.
Data diodes are network devices which increase security by enforcing one-direction information flow.  Owl Computing Technologies’ data diodes hide information about the data sources, such as network addresses.  Data diodes are in increasing demand in industrial automation, especially for critical infrastructure such as power generation, oil & gas production, water and wastewater treatment and distribution, and other industries.  The term “diode” is derived from electronics, which refers to a component that allows current to flow in only one direction.
The most common implementation of data diodes is “read only”, from the industrial automation systems to the other systems, such as operations management and enterprise systems.


This method is not intended to establish what has been called an “air gap” cybersecurity defense, where there is an unreasonable expectation that no incoming data path will exist.  An “air-gap” is when there is no physical connection between two networks.  Information does not flow in any direction.  Instead, the data diode method is used as part of a “defense in depth” cybersecurity defense, such as the NIST 800-82 and IEC 62443 standards.  It is applied to network connections which have greater impact on the integrity of the industrial automation system.

One-way information flow frustrates the use of industrial protocols which use the reverse direction to assure that the data was successfully received, and subsequently triggers failsafe and recovery mechanisms when information flow is interrupted.  A data diode can pass files of any format and streaming data such as videos and an effective file transfer, vendor neutral approach, in industrial automation is to use the CSV file format.  The acronym CSV stands for comma-separated values, and there are many tools available that quickly format these files on the industrial automation system side of the data diode, and then “parse” or extract data on the other side of the data diode.

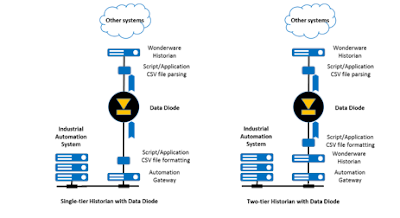
There are 2 architectures which are feasible with data diodes, as shown in the diagrams below.
The single-tier historian architecture uses the industrial automation system’s gateway, which is typically connected to batch management, operations management and advanced process control applications.  This gateway is sometimes called a “server”, and it is often an accessory to a process historian.  A small software application is added which either subscribes to or polls information from the gateway, and this application periodically formats the files and sends them to the data diode.  Another small application receives the files, “parses” the data, and writes the data into the historian.
The Wonderware Historian version 2014 R2 and later versions can efficiently receive constant streams of bulk information, and then correctly insert this information, while continuing to perform the other historian functions.  This function is called fast load.

For L2-L3 integration, the two-tier historian architecture also uses the industrial automation system’s gateway.  The lower tier historian often uses popular protocols such as OPC.  This historian is used for data processing within the critical infrastructure zone, and it is often configured to produce basic statistics on some of the data (totals, counts, averages etc.)  A small software application is added which either subscribes to or polls information from the lower tier historian, and this application periodically formats the files and sends them to the data diode.  Another small application receives the files, “parses” the data, and writes the data into the upper tier historian.

The Wonderware Historian has been tested with a market-leading data diode product from Owl Computing Industries, called OPDS, or Owl Perimeter Defense System.  It uses a data diode to transfer files, TCP data packets, and UDP data packets from one network (the source network 1) to a second, separate network (the destination network 2) in one direction (from source to destination), without transferring information about the data sources.  The OPDS is composed of two Linux servers running a hardened CentOS 6.4 operating system.  In the diagram below, the left Linux server (Linux Blue / L1) is the sending server, which sends data from the secure, source network (N1) to the at-risk, destination network (N2). The right Linux server (Linux Red / L2) is the receiving server, which receives data from Linux Blue (L1).


The electronics inside OPDS are intentionally physically separated, color-coded, and manufactured so that it is impossible to modify either the sending or the receiving subassemblies to become bi-directional.  In addition, the two subassemblies communicate through a rear optic fiber cable assembly which makes it easy for inspectors to disconnect to verify its functionality.  The Linux Blue (L1) server does not need to be configured, as it accepts connections from any IP address. The Linux Red (L2) server, however, must be configured to pass files onto the Windows Red (W2) machine.  This procedure is discussed in section 8.2.2.6 of the OPDS-MP Family Version 1.3.0.0 Software Installation Guide.  The 2 approaches can be combined across multiple sites, as shown in the diagram below.  Portions of the data available in the industrial automation systems are replicated in the upper tier historian.

Sunday, November 1, 2015

Will Data Historians Die in a Wave of IIoT Disruption? A transformation in data historian thinking will happen!

A group of us were asked to comment on this article by , President and Principal Analyst, LNS Research, on . It certainly is an integrating questions, and valid question in the current industrial , operational transformation that is happening around us. As we answered it on email, I thought it is a valid topic for blog discussion.

http://www.automationworld.com/databases-historians/will-data-historians-die-wave-iiot-disruption


My immediate first response is “that the traditional thinking of industrial data historians will transform”. Actually it is already transforming, due to type , volume, and required access to the data. It is important to not look at the situation as a problem, but as a real opportunity to transform your operational effectiveness through increased embedded “knowledge and wisdom”:
The article raises the question of how or is this a disruptive point in the industrial data landscape, I would argue that is a “transformation point”.

Mathew states in the article:

Even so, one area of the industrial software landscape that many believe is ripe for disruption is the data historian. The data historian emerged out of the process industries in the early 1980s as an efficient way to collect and store time-series data from production. Traditionally, values like temperature, pressure and flow were associated with physical assets, time stamped, compressed, and stored as tags. This data was then available for analysis, reporting and regulatory purposes.
Given the amount of data generated, a modest 5,000-tag installation that captures data on a per-second basis can generate 1 TB per year. Proprietary systems have proven superior to open relational databases, and the data historian market has grown continually over the past 35+ years.
The future may seem very bright for the data historian market, but there is disruption coming in the form of IIoT and industrial Big Data analytics.
As these systems have been rolled up from asset or plant-specific applications to enterprise applications, the main use cases have slightly expanded, but generally remained the same. Although there is undisputed incremental value associated with enterprise-level data historians, it is well short of the promise of IIoT.
In our recent post on Big Data analytics in manufacturing, I argued that Big Data is just one component of the IIoT Platform, and that volume and velocity are just two components of Big Data. The other (and most important) component of Big Data is variety, making the three types structured, unstructured and semi-structured. In this view of the world, data historians provide volume and velocity, but not variety.
If data historian vendors want to avoid disruption, expand the user base, and deliver on the promise of IIoT use cases, solutions must bring together all three types of data into a single environment that can drive next-generation applications that span the value chain.
It is unlikely that the data historian will die any time soon. It is, however, highly likely that disruption is coming, making the real question twofold: Will the data historian be a central component of the IIoT and Big Data story? Which type of vendor is best positioned to capture future growth—traditional pure-play data historian provider, traditional automation provider with data historian offerings, or disruptive IIoT provider?
If the data historian is going to take a leadership role in the IIoT platform and meet the needs of end users, providers in the space will have to develop next-generation solutions that address the following:
·         How to provide a Big Data solution that goes beyond semi-structured time-series data and includes structured transactional system data and unstructured web and machine data.
·         How to transition to a business/pricing model that is viable in a cheap sensor, ubiquitous connectivity, and cheap storage world.
·         How to enable next-generation enterprise applications that expand the user base from process engineers.”

The comments are very valid, that the data we now capturing is increased in both volume and variety, but I would argue that it needs to transformed into contextualized information, to knowledge so that  proportional wisdom growth can occur. The diagram below shows the potential direction many companies can go, of blowing out on data and not gaining the significant advantage of wisdom for operational efficiency from the increased data in the Industrial “sea”.

The way in which people will access and use data is transforming, they not using it just for analysis on traditional trends etc. They are applying big data tools, and modeling environments to understand situations early in assets condition, operational practices, and process behavior.

They are expecting to leverage this past history to predict the future through models that “what ifs” can applied. They are expecting access to their answers from people who with limited experience, in role or location (site/ plant awareness). They will not use traditional tools, they will expect “natural langue search” to transverse the information, and knowledge “ no matter where the location.

The article took me back to a body of work I collaborated on with one of the leading Oil and Gas companies around “Smart Fields” and in those conversations we talked about the end of the historian as we know it, due to the distributed nature of data capture, and the availability of memory, why would historise to disk vs leave the history in the device in memory.

I think this really drives the thought pattern around how the data is used, and the key 3 are:
  • Operational “actionable decisions”
  • Operational/ process improvements, through analysis and understanding to build models that transform situations in history to knowledge about the future.
  • Operational, process records archiving.

The future is federated history that partitions the “load” between most-recent transient fast history in the device itself (introducing a concept of  “aggregators”) with periodic as-available uploads to more permanent storage. These local devices will have their own memory storage and can “aggregate” the data to central long term storage.

But when you are access information in the now you will not go to historian, you will go to the information model, that will navigate across this “industrial sea” of data and information, delivering it fast, and in a knowledge form.

So is the end of historian here, I would say no, but certainly as the article points out the transformation of the enterprise information system is happening, so are the models you will buy, manage, access the data.  


Thursday, October 22, 2015

Help Operators move from “Coping” to beyond “Optimizing”

This is a great blog from Stan DeVries, really opening some of the challenge thinking.

"A recent meeting with a customer discussed the best practices for centralized control rooms and integrated operations centers.  They summarized 4 levels of operator performance:
  •         Coping
  •          Aligning
  •          Optimizing
  •          Stretching

While the focus of the meeting was on optimizing, the customer pointed out that we must enable the newer operators who begin by “coping”.  It is worthwhile to consider the differences between these 4 levels:

  •         Coping requires high concentration on operations activity and events, where the operator has little flexibility to adapt to teamwork with other operators.  The operator has been qualified to work in a centralized control room or integrated operations center, but they have difficulty to maintain pace.
  •   Aligning requires moderate concentration, where the operator can safely and reliably adapt to most of the teamwork activity, but reaching team targets is still difficult, such as value chain efficiency or throughput.
  •   Optimizing requires a different type of concentration, where the operator has learned how to cope and how to align, but now the operator focuses on achieving the team targets, and the targets change periodically – in some industries (e.g. power generation and natural gas liquids processing) the targets change every 15 minutes.
  •   Stretching is achieved by “error free” operators who have learned how to beat the optimization targets.


The key question is how can operators achieve and sustain best performance?  A quick answer is more training, but too often the training paradigm isn’t adequate.  Best practices have shown that the effective method is treating the targets like a game, and applying newer visualization to support it.  Before we look at any example of a “game” or possible visualization, we need to consider the innovation in the training approach:

  •          Training becomes holistic – the students learn about how to perform in team settings
  •          Training moves beyond the classroom – classroom training is essential, but structured on-         the-job training becomes very important
  •          Operator performance becomes less “private” – team performance is visible and shared.


So what can the new training experience feel like?  Consider an example which has been published in regional industry conferences, where the initial focus was optimizing energy across multiple sites and all operating shifts:


The dark blue diamonds is hourly efficiency performance over a wide range of throughput, across all sites and all shifts.  The magenta squares are the result of one month of teamwork, and the yellow triangles are the results after two months.  Please observe a few key characteristics of this experience:
  • Very dynamic operating conditions
  • “Blind” presentation – operator names are not shown
  • Graphical context – instead of bar or gauge displays, operators see how their performance compares with others.

The operator is given other detailed displays both during training and for normal operation, but the exercise is focused on teamwork.  Consider the significant improvement in the above displays."

Wednesday, October 21, 2015

Happy Marty McFly Day : How much did come true or past?

This post by Morris Miselowski sparked fun and interest:
http://businessfuturist.com/time-travel-comes-true-this-wednesday-backtothefuturepart2-various-radio-stations/

"In 23 minutes and 8 seconds, I need you to look out your window and see if you can spot Back to the Future 2's DeLorean flying car with Marty McFly on board as it lands from its journey from 1989 to the future - today Wednesday 21st October 2015.

What will he find, what will have changed and what will he think of the changes he sees?

Despite the fact we don’t quite yet have hoverboards and DeLorean flying cars, fuelled with rubbish turned into nuclear fission there are lots of things that are predicted in the 1985 film that have come about.

Here’s the stuff that’s come true:
  • Flat screen TV’s
  • Video conferencing
  • Fingerprint biometrics
  • Artificial Intelligence
  • Voice activated and responsive technology
  • Hydroponics
  • Brain controlled / wireless video games
  • Handheld tablets
  • Wearable technology
  • Holographic displays
  • Visual Displays
  • Drones
  • Bionic Implants
and here’s some that’s almost come true:
  • Hover boards – although there are some versions of boards that might be called hover boards
  • Self-lacing shoes – although Nike took out a patent on this tech and is suspected to release a version for next week’s anniversary
  • Turning garbage into fuel – we can do and have done it for 30 years, but not with cold fusion
  • Pepsi Perfect -although Pepsi is said to be releasing a limited edition for next week
  • Automated fuelling is being trialled now by Tesla and others
  • Stationery exercise bike at cafes – but we are very sports and health conscience
  • Flying cars – we have them but just can’t use them
  • Fax machines @ all phone booths – this if of course past tech, but it did infer an internet of sorts would be in existence
  • Rejuvenation masks
No surprise, I love this movie. It’s a seminal Hollywood moment that changed my career and life and nostalgically I’ve travelled the last  30 years alongside Marty McFly and the DeLorean into the future.

It’s also one of the movie’s that sparked our curiosity about what’s next and is the source of the two questions I get asked most often – where’s my hoverboard and where’s my flying car?

It also shows how wildly our life changes in such a short period of time.

In 1985 it would have been impossible to believe that the Berlin Wall and the Soviet Union would collapse. South Africa apartheid would end. A terrorist attack would fell the World Trade Centre. That 4 billion and growing smart phones would inhabit the world. That snail mail would have given way to digital mail. That the word Google would be used so readily in everyday conversation. That sharing our most intimate thoughts and actions online in social media would be so ordinary. That cures and treatments for many diseases including AIDS would have been found and that China would be on target to become an economic superpower."


While the industrial sector does not move as fast, it has transformed since 1985 from the first generation PLCs, and now you see operational interaction, decisions faster, and across the globe manufacturing value chains.
Time is getting shorter with product runs, and decisions.

Saturday, October 17, 2015

Span of Awareness, Scope of Operation (Responsibility)!!!!

These are terms and concepts that will become a normal wording when defining the new paradigms in Operational Experience of the “Distributed Multi Point Operational Landscapes”.

Two weeks I posted “The Changing Landscape of Supervisory System from HMI, CCR to “Distributed Multi Point Operational Landscapes”, and there was a significant interest, and questions (on email as normal), so I thought I continue to answer some of the topics.  For the last couple of weeks I have been involved in a number of projects that these concepts are having to sorted and defined, in order to complete the design.

So let’s clarify what we mean:

Span of Awareness:
Span of Awareness is relative to what a user / worker is exposed to, this means through the device (control room, mobile phone, tablet, remote station etc) and notification systems he is logged on too, now that the systems are becoming “self-aware”.  Traditionally the worker has only been aware of the equipment and process states that his UI could show but today this is changing to a worker/ member of the “operational team” being notified when the situation of the process is in an abnormal state, and the worker could contribute to resolution.
The concept of “always being connected” now applies to the industrial landscape, and with virtual operational team members being key to modern actionable decision chain.

Scope of Operation (Responsibility):
Scope of responsibility relates to what a work is assign, what “activities” that fall under the workers responsibility at this time. Based upon location, what the worker logs onto, or passed what activities (tasks) to perform, the system must be aware, and provide the worker with first up awareness, and then responsibility. Key is workers, responsibility and activities can vary from day to day, the system must handle this. Scope of Responsibility is very important when managing alarms, as the initial response needs to assigned to the correct user, this maybe not a station.

This is a new dynamic in the distributed supervisory solutions, where the no longer can you design responsibility of control to a station, as what is a station? A responsible user could be on a mobile devices, logon to a fixed station in the system, and drill into a situation and take an action, but that station could not at the location, or temporarily manned.

Sunday, October 4, 2015

Operational Windows Enable are a basis for Operational Management Experience (IOC)

I have talked about the drive by many companies to reduce “Operational Variation” across plants, teams, and industries. This is core to the journey to "operation excellence" gaining consistency, awareness and early detection of situations. When you look at the table below on the levels of human operational automation, the drive of the integrated operational experience is trying to reach level 5 "Worker management by exception", a big part of this is awareness of current operational process status relative to optimum.   


There are many ways that operational control will be implemented, as pointed out it could be through actions and processes becoming embedded and certainly this will be the big driver in the road to “Operational Innovation”.

But another way is through displaying key operational indicators to a knowledge worker, where  these indicators are mapped within boundary conditions. These boundaries are set up based on the time and relevance to the role and activity/ task the knowledge worker is performing. This sort of “operating Window” enables the knowledge worker the context, and recommendations, knowledge to enable operational decisions in a timely and ever consistent way. This same operational window can be used over multiple sites/ and teams for that role and activity providing consistency control.
The figure below is an example of an operational window.


Where on the left you can see the operational running trend, but you can see the changing boundary conditions of operation based upon product etc., The green shows the area where optimum control, safety, and production performance is. The right hand side you have reasons, and number instances of deviations for periods out of operational control.


Placing this sort of operational window where the operational boundaries come from the business strategy but in context of the role and activity no matter where in the plant operational team, but the feedback and running side is real-time from the plant. This window is place adjacent to  current control/ HMI screens the operator is using, or the maintenance or process screens the users are working, and you start the transformation to a knowledge worker. 


Sunday, September 27, 2015

The Changing Landscape of Supervisory Systems from HMI, / Common Control Room, to “Distributed Multi Point Operational Landscapes” !!!!!

For the last couple of years we have seen the changing supervisory solutions emerging, that will require a rethink of the underlying systems, and how they implemented and the traditional HMI, Control architectures will not satisfy! Certainly in upstream Oil and Gas, Power, Mining, Water and Smart Cities we have seen a significant growth in the Integrated Operational Center (IOC) concept. Where multiple sites control comes back into one room, where planning and operations can collaborate in real-time. Initially companies just virtualize their existing systems back, and then they standardize the experience for operational alignment and effectiveness, and then they simulation, and model, not many have got to this last step.

But in the last couple of weeks I have sat in discussions where people talk about this central IOC, which is key. When you start peeling back the “day in the life of operations” the IOC is only the “quarterback” in a flexible operational team of different roles, contributing different levels of operational. Combined with dynamic operational landscape, where the operational span of control of operational assets, is dynamically changing all the time. The question is what does the system look like, do the traditional approaches apply?


When you look at the operational landscape below, you can see 100s of operational control points where humans will have to interact with the system, with different spans of control, and operational points will be manned and unmanned on regular basis.


Traditionally companies have used isolated (siloed) HMI, DCS workstation controls at the facilities, and then others at the regional operational centers and then others at the central IOC, and stitched them together. Now you add the dynamic nature of the business with changing assets, and now a mobile workforce we have addition operational stations that of the mobile (roaming worker). All must see the same state, with scope to their span of control, and accountability to control. 
Since the 1990’s, control system technology has enabled a flexible delivery of work, where workers can support both “normal” and “abnormal” situations from multiple locations, either in the same room or across the world.  This mechanism has to be reliable, easy to implement, and easy to maintain.  Some customers have applied this mechanism to more than 5 different “points of operation”, which range from equipment panels, mobile devices and local control rooms to regional and national operations centers.

The requirements have become the following:

  1.        “Transparency of Trusted Operational State”: with real-time operational actionable decisions becoming key, the ability to monitor, the system raise the situation automatically through operational, asset self-awareness. So there is transparency to whole operational landscape situational state.
  2.        “Point of operation”: the implementation must support a configuration where one of the multiple points of operation uniquely can operate, which includes responding to alarms.
  3.        Simultaneous “point of operation”: the implementation must also support a configuration where more than 1 worker can operate, which is rarely more than 2.
  4.        “Span of operation” flexibility: each “point of operation” can be an individual PID, start/stop or device, or it can be a broader “span” of operation.  This “span” must be assignable in a flexible manner, where the “span” can be adjusted to become narrower or broader.  Example conditions include night time or overhaul conditions for some operations.
  5.        Ownership visibility: each possible point of operation must have a simple and clearly visible indication that it doesn’t have ownership, and reinforced indication when it does have the ownership. Clear visibility across the operational landscape as who has point of control, and as a team accountability is understood to respond to the situation promptly.
  6.        Management of alarms: it is essential for safety, legal, environmental and health requirements that new alarms animate, suppress/shelve, annunciate and trigger display changes only at the point(s) of operation, and only the workers using the point(s) of operation can acknowledge or silence new alarms. This means all alarms from asset to process, operational, but scope of alarm responsibility is aligned with span of control, but as a team there are “no blind spots” and alarm, situational awareness is escalated based on responsiveness, and situation. Assumption of control, and someone doing something must be removed.
  7.        Manage of operational events across different points of operation;Example operators want to be able to set operational limits/events across different operations? How is this managed and governed?
  8.         IT/OT seamless integration;Operating, monitoring, trending, alarming and integration with other islands of information to enable the teams to make informed decisions.
  9.         Reliability, upgradable, cyber security, network architecture, cloud;
  10.      One problem cannot bring down the whole operations!!
  11.      Assignment of operation: an authorized worker must have an easy and reliable means to assign and adjust the spans of operation.  The following diagram shows examples of transferring the span of operation between a roving user, a local control room, and a remote operations center:


In the above diagram, Areas or Sites “A” through “D” require supervision by different users or by the same user in different locations.  This scenario also applies to multiple operations consoles or desks within the same room.  The span of operation varies with the operations situations.  The span of operation can overlap among multiple users and multiple locations.

We need one system, but multiple operational points, and layouts, awareness so the OPERATIONAL TEAM can operate in unison, enabling effective operational work. Below is a high-level diagram of the operational team by the situation, you will have multiple skills in each situation, people will move through the situational state, but the diagram shows the merging operational work characteristics.


This emerging dynamic multi-point operational landscape is big topic that I will explore over the next few weeks, as traditional thinking, traditional architectures, and traditional implementations will not enable the transformation in operational work needed to satisfy effective agile operations.