Sunday, November 29, 2015

Forecasting and Predicting, Must be a Cornerstone of the Modern Operational System

For the last couple of weeks Stan and I have been working with a number of leading companies in Oil and Gas, Mining, and F & B around their Operational Landscape or experience of the future.
Too often the conversations start off from a technology point, and we spend the initial couple of days trying to swing the conversation to the way in which they need to operate in the future and what their plans are around operations.

It becomes clear very quickly that there is allot of good intent, but real thought into how they need to operate in order to meet production expectations both in products and margin has not been worked through.

Over and over again we see the need for faster decisions, in a changing agile world, and this requires an "understanding of the future" this maybe only 1/2 hour. The time span of future required for decisions depends on role, (same as history) but it is clear that modeling of future is not just something for the planner, it is will become a native part of all operational systems.

This blog from Stan captures some of the necessary concepts.
  
Operations management systems must deliver better orientation than traditional reporting or decision support systems.  One important aspect of operations is the dynamic nature – there will be a journey of changing schedules, changing raw material capabilities, changing product requirements and changing equipment or process capabilities.


It might be helpful to consider desired and undesired conditions, using the analogy of driving a car on a long trip.  The planned route has turns, and it may involve traffic jams, detours, poor visibility due to heavy rain or fog; the driver and the car must stop periodically; and the driver may receive a telephone call to modify the route.  The following diagram is a sketch which displays how an integrated view might appear:

In the above example, the actual performance is at the upper limit for the target, and the scheduled target and constraints will shift upward in the near future.  The constraint is currently much higher than the scheduled target limits, but it is forecast-ed to change so that in some conditions in the future, the constraint will not allow some ranges of targets and limits.  This simple view shows a single operations measure with its associated constraints and target.
  • At this stage, we propose a definition of “forecasting”: a future trend which is a series of pairs of information, where the pairs include a value and a time.  The accuracy of the values will be poorer as the time increases, but the direction of the trend (trending down or up, or cycling) and the values in the near future are sufficiently useful.
  • In contrast, “predicting” is an estimate that a recognized event will likely happen in the future, but the timing is uncertain.  This is useful for understanding “imminent” failures.

The following diagram shows an example of estimating the probabilities of 5 failure categories, where the first (rotor thermal expansion) is the most likely.


Given these two definitions, it is helpful to consider industrial equipment behaviors.
  • Several types of equipment, especially fixed equipment such as heat exchangers, chillers, fired heaters etc. exhibit a gradual reduction in efficiency or capacity, or exhibit varying capability depending upon ambient temperature and the temperature of the heat transfer fluid (e.g. steam, hot oil, chilled water).  While the performance is changing, the equipment hasn’t failed, although its performance might reach a level which justifies an overhaul.  In extreme cases, sudden failures can occur, such as tube rupture or complete blockage.  These benefit from “forecasting”.
  • Other types of equipment, such as agitators, pumps, turbines, compressors etc. exhibit sudden failures.  These benefit from “predicting”.

One analogy of incorporating both “forecasting” and “predicting” is that it is like driving a car without looking forward through the windshield/windscreen, such as shown in the following sketch:


In the above sketch, the road behind the car is clear, but ahead, a potential collision will occur.  High-performance operations requires that teams prevent unplanned shutdowns or other events.

Saturday, November 21, 2015

The Benefits if Using TOGAF with ISA-95

Blog by Stan Devries:

ISA-95 is the strongest standard for operations management interoperability, and its focus is on data and its metadata.  ISA-95 continues to evolve, and recent enhancements address the needs of interoperability among many applications, especially at Level 3 (between process control and enterprise software systems).  One way to summarize ISA-95’s focus is on business and information architectures.

TOGAF is the strongest standard for enterprise architecture.  One way to summarize TOGAF’s focus is on business architecture, information architecture, systems/application architecture and technology architectures.  When considered with this perspective, ISA-95 becomes the best expression of the data architecture within TOGAF, and ISA-95 becomes the best expression of portions of the business architecture.  Central to the TOGAF standard is an architecture development method (ADM), which encourages stakeholders and architects to consider the users and their interactions with the architecture before considering the required data.  The key diagram which summarizes this method is the following:
The circular representation and its arrows summarize the governance features.  One example is the architecture vision (module A in the above diagram).  This vision could include the following principles as examples:
  •          Mobile will be a “first class citizen”
  •          Interaction with users will be proactive wherever possible
  •          Certain refinery operations must continue to run without core dependencies
  •          Take advantage of Cloud services when possible


This framework provides a better language for each group of stakeholders.  The following table, which is derived from the Zachman framework, maps these stakeholders to a set of simple categories:


The categories of “when” and “motivation” enables the architecture governance to consider transformational requirements, such as prevention of undesired situations and optimization of desired situations.  In this context, ISA-95 adds value in Data (what) and Function (how), for all of the stakeholders, but it doesn’t naturally address where, who, when and why.  Furthermore, ISA-95 doesn’t have a governance framework.  In this context, “where” refers to the architecture’s location, not equipment or material location.
TOGAF lacks the rich modeling for operations management, especially for equipment and material, which is provided by ISA-95.  The combination is powerful and it reduces any tendency to produce passive, geographically restricted architectures.

Friday, November 13, 2015

Information Technology/Operations Technology (IT/OT) for the Oil and Gas Industry

Blog from Stan DeVries

Since 2006, some oil & gas companies have attempted to align what has been called IT and OT with different organization approaches.  It is valuable to consider what these two “worlds” are:
The world of IT is focused on corporate functions, such as ERP, e-mail, office tools etc.  The following key characteristics apply:
  •          The dominant verb is “manage”.
  •          Systems design assumes that humans are the “end points” – information flows begin and end with humans.
  •          The focus is on financial aspects – revenue, margins, earning per share, taxes etc.
  •          The focus is also on cross-functional orchestration of the corporate supply chain
  •          The main technique is reporting – across all sites in the corporation.
  •          One of the methods is to enforce a standard interface between enterprise applications (especially ERP) and the plants/oil fields/refineries/terminals.
  •          Policies for managing information are mostly homogenous, and the primary risk is loss of data.

In contrast, the world of OT is focused on plant operations functions.  The following key characteristics apply:
  •          The dominant verb is “control”.
  •          Systems design assumes that “things” (equipment, materials, product specifications etc.) are the “end points” – information flows can begin and end without humans.
  •          The focus is on operational aspects – quality, throughput, efficiency etc.
  •          The focus is also on providing detailed instructions for operations areas – to equipment and to humans
  •          The main technique is controlling – within a related group of sites or a single site.
  •          One of the methods is to accommodate multiple protocols and equipment interfaces.
  •          Policies are usually diverse and asset-specific; risk includes loss of data, loss of life, loss of environment, loss of product and loss of equipment.


These two worlds must be integrated but their requirements and strategies must be kept separate.  The following diagram suggests a strategy to achieve this:


The above diagram recommends the following methods to bridge these two worlds:
  •          Use a “value generation” metric to justify and harmonize the equal importance of these two worlds.  “Value” can be measured both in terms of financial value (more on this below) and in terms of risk.
  •          Reconcile units of measure using thorough activity-based costing, down to senior operators and the technicians which support them.
  •          Correctly aggregate and disaggregate information at the appropriate frequency.  Operators require hourly information (in some industries, every 15 minutes).
  •          Centralize and distribute information with an approach called “holistic consistency” – allow for the diversity of information structures and names for each area of operation, but enforce consistent structure and naming between sites (or in some cases, between operations areas).
  •          Integrate and interoperate with appropriate methods and standards, which must address visualization, mobility, access and other aspects as well as information.
  •          Apply a consistent cybersecurity approach across multiple areas of the IT/OT system, allowing for information to flow “down” and “across”.  An “air gap” approach has been proven to be unsustainable, but a multi-level approach called “defense in depth” has been proven to be effective and practical.

Oil and gas companies have implemented a variety of organization structures for bridging these two worlds.  Some companies divide IT into two areas, called Infrastructure and Transformation.  New technologies which are strongly linked to new ways of working are first managed by the Transformation section of IT, and then as these mature, they are transferred to Infrastructure.  The main functions of OT are closely linked to Transformation, because operations can continue without OT – OT is almost always a value-add.  We observe the following organizational approaches:
  •         IT reporting to Finance, and OT reporting to Engineering/Technical Services or to Operations
  •         OT reporting to Transformational IT, with an operations-background IT executive

Regardless of the organization approach, the objectives are reliable and business-effective improvement, whether in the office or in the sites.

Saturday, November 7, 2015

Data Diodes for Levels 2-3 and 3-4 Integration

Blog entry by Stan DeVries.
Data diodes are network devices which increase security by enforcing one-direction information flow.  Owl Computing Technologies’ data diodes hide information about the data sources, such as network addresses.  Data diodes are in increasing demand in industrial automation, especially for critical infrastructure such as power generation, oil & gas production, water and wastewater treatment and distribution, and other industries.  The term “diode” is derived from electronics, which refers to a component that allows current to flow in only one direction.
The most common implementation of data diodes is “read only”, from the industrial automation systems to the other systems, such as operations management and enterprise systems.


This method is not intended to establish what has been called an “air gap” cybersecurity defense, where there is an unreasonable expectation that no incoming data path will exist.  An “air-gap” is when there is no physical connection between two networks.  Information does not flow in any direction.  Instead, the data diode method is used as part of a “defense in depth” cybersecurity defense, such as the NIST 800-82 and IEC 62443 standards.  It is applied to network connections which have greater impact on the integrity of the industrial automation system.

One-way information flow frustrates the use of industrial protocols which use the reverse direction to assure that the data was successfully received, and subsequently triggers failsafe and recovery mechanisms when information flow is interrupted.  A data diode can pass files of any format and streaming data such as videos and an effective file transfer, vendor neutral approach, in industrial automation is to use the CSV file format.  The acronym CSV stands for comma-separated values, and there are many tools available that quickly format these files on the industrial automation system side of the data diode, and then “parse” or extract data on the other side of the data diode.

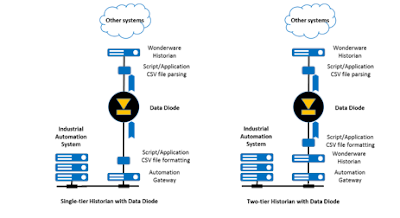
There are 2 architectures which are feasible with data diodes, as shown in the diagrams below.
The single-tier historian architecture uses the industrial automation system’s gateway, which is typically connected to batch management, operations management and advanced process control applications.  This gateway is sometimes called a “server”, and it is often an accessory to a process historian.  A small software application is added which either subscribes to or polls information from the gateway, and this application periodically formats the files and sends them to the data diode.  Another small application receives the files, “parses” the data, and writes the data into the historian.
The Wonderware Historian version 2014 R2 and later versions can efficiently receive constant streams of bulk information, and then correctly insert this information, while continuing to perform the other historian functions.  This function is called fast load.

For L2-L3 integration, the two-tier historian architecture also uses the industrial automation system’s gateway.  The lower tier historian often uses popular protocols such as OPC.  This historian is used for data processing within the critical infrastructure zone, and it is often configured to produce basic statistics on some of the data (totals, counts, averages etc.)  A small software application is added which either subscribes to or polls information from the lower tier historian, and this application periodically formats the files and sends them to the data diode.  Another small application receives the files, “parses” the data, and writes the data into the upper tier historian.

The Wonderware Historian has been tested with a market-leading data diode product from Owl Computing Industries, called OPDS, or Owl Perimeter Defense System.  It uses a data diode to transfer files, TCP data packets, and UDP data packets from one network (the source network 1) to a second, separate network (the destination network 2) in one direction (from source to destination), without transferring information about the data sources.  The OPDS is composed of two Linux servers running a hardened CentOS 6.4 operating system.  In the diagram below, the left Linux server (Linux Blue / L1) is the sending server, which sends data from the secure, source network (N1) to the at-risk, destination network (N2). The right Linux server (Linux Red / L2) is the receiving server, which receives data from Linux Blue (L1).


The electronics inside OPDS are intentionally physically separated, color-coded, and manufactured so that it is impossible to modify either the sending or the receiving subassemblies to become bi-directional.  In addition, the two subassemblies communicate through a rear optic fiber cable assembly which makes it easy for inspectors to disconnect to verify its functionality.  The Linux Blue (L1) server does not need to be configured, as it accepts connections from any IP address. The Linux Red (L2) server, however, must be configured to pass files onto the Windows Red (W2) machine.  This procedure is discussed in section 8.2.2.6 of the OPDS-MP Family Version 1.3.0.0 Software Installation Guide.  The 2 approaches can be combined across multiple sites, as shown in the diagram below.  Portions of the data available in the industrial automation systems are replicated in the upper tier historian.

Sunday, November 1, 2015

Will Data Historians Die in a Wave of IIoT Disruption? A transformation in data historian thinking will happen!

A group of us were asked to comment on this article by , President and Principal Analyst, LNS Research, on . It certainly is an integrating questions, and valid question in the current industrial , operational transformation that is happening around us. As we answered it on email, I thought it is a valid topic for blog discussion.

http://www.automationworld.com/databases-historians/will-data-historians-die-wave-iiot-disruption


My immediate first response is “that the traditional thinking of industrial data historians will transform”. Actually it is already transforming, due to type , volume, and required access to the data. It is important to not look at the situation as a problem, but as a real opportunity to transform your operational effectiveness through increased embedded “knowledge and wisdom”:
The article raises the question of how or is this a disruptive point in the industrial data landscape, I would argue that is a “transformation point”.

Mathew states in the article:

Even so, one area of the industrial software landscape that many believe is ripe for disruption is the data historian. The data historian emerged out of the process industries in the early 1980s as an efficient way to collect and store time-series data from production. Traditionally, values like temperature, pressure and flow were associated with physical assets, time stamped, compressed, and stored as tags. This data was then available for analysis, reporting and regulatory purposes.
Given the amount of data generated, a modest 5,000-tag installation that captures data on a per-second basis can generate 1 TB per year. Proprietary systems have proven superior to open relational databases, and the data historian market has grown continually over the past 35+ years.
The future may seem very bright for the data historian market, but there is disruption coming in the form of IIoT and industrial Big Data analytics.
As these systems have been rolled up from asset or plant-specific applications to enterprise applications, the main use cases have slightly expanded, but generally remained the same. Although there is undisputed incremental value associated with enterprise-level data historians, it is well short of the promise of IIoT.
In our recent post on Big Data analytics in manufacturing, I argued that Big Data is just one component of the IIoT Platform, and that volume and velocity are just two components of Big Data. The other (and most important) component of Big Data is variety, making the three types structured, unstructured and semi-structured. In this view of the world, data historians provide volume and velocity, but not variety.
If data historian vendors want to avoid disruption, expand the user base, and deliver on the promise of IIoT use cases, solutions must bring together all three types of data into a single environment that can drive next-generation applications that span the value chain.
It is unlikely that the data historian will die any time soon. It is, however, highly likely that disruption is coming, making the real question twofold: Will the data historian be a central component of the IIoT and Big Data story? Which type of vendor is best positioned to capture future growth—traditional pure-play data historian provider, traditional automation provider with data historian offerings, or disruptive IIoT provider?
If the data historian is going to take a leadership role in the IIoT platform and meet the needs of end users, providers in the space will have to develop next-generation solutions that address the following:
·         How to provide a Big Data solution that goes beyond semi-structured time-series data and includes structured transactional system data and unstructured web and machine data.
·         How to transition to a business/pricing model that is viable in a cheap sensor, ubiquitous connectivity, and cheap storage world.
·         How to enable next-generation enterprise applications that expand the user base from process engineers.”

The comments are very valid, that the data we now capturing is increased in both volume and variety, but I would argue that it needs to transformed into contextualized information, to knowledge so that  proportional wisdom growth can occur. The diagram below shows the potential direction many companies can go, of blowing out on data and not gaining the significant advantage of wisdom for operational efficiency from the increased data in the Industrial “sea”.

The way in which people will access and use data is transforming, they not using it just for analysis on traditional trends etc. They are applying big data tools, and modeling environments to understand situations early in assets condition, operational practices, and process behavior.

They are expecting to leverage this past history to predict the future through models that “what ifs” can applied. They are expecting access to their answers from people who with limited experience, in role or location (site/ plant awareness). They will not use traditional tools, they will expect “natural langue search” to transverse the information, and knowledge “ no matter where the location.

The article took me back to a body of work I collaborated on with one of the leading Oil and Gas companies around “Smart Fields” and in those conversations we talked about the end of the historian as we know it, due to the distributed nature of data capture, and the availability of memory, why would historise to disk vs leave the history in the device in memory.

I think this really drives the thought pattern around how the data is used, and the key 3 are:
  • Operational “actionable decisions”
  • Operational/ process improvements, through analysis and understanding to build models that transform situations in history to knowledge about the future.
  • Operational, process records archiving.

The future is federated history that partitions the “load” between most-recent transient fast history in the device itself (introducing a concept of  “aggregators”) with periodic as-available uploads to more permanent storage. These local devices will have their own memory storage and can “aggregate” the data to central long term storage.

But when you are access information in the now you will not go to historian, you will go to the information model, that will navigate across this “industrial sea” of data and information, delivering it fast, and in a knowledge form.

So is the end of historian here, I would say no, but certainly as the article points out the transformation of the enterprise information system is happening, so are the models you will buy, manage, access the data.